CISOs aren’t just managing security anymore. They’re managing perception at the board level, in audit rooms, and across the C-suite. And in 2025, perception without proof is a liability.
According to IBM, the average cost of a data breach has climbed to $4.88 million. But here’s the real issue: most security operations centers (SOCs) can’t clearly show if they’re actually reducing risk or just reacting faster.
You’re flooded with alerts, dashboards, and KPIs. But how do you know which ones move the needle?
This article is your shortcut to clarity. We’ve distilled the 15 SOC metrics that every CISO must track and lead with. These aren’t vanity numbers. They’re the strategic signals that show your team’s effectiveness, your posture’s maturity, and your readiness to face what’s next.
Let’s get into it.
Why SOC Metrics are a CISO’s Sharpest Weapon?
Metrics aren’t just dashboards. They’re decision frameworks.
The modern CISO sits at the intersection of risk, tech, and business accountability. You’re not just keeping the lights on; you’re defending shareholder value, regulatory posture, and brand trust. But without the right metrics, it’s impossible to prove you’re winning.
Too often, SOCs fall into two traps:
- Operational noise: Reporting on alert counts, ticket closures, tool uptime.
- Vanity metrics: Overstating coverage or reporting zero incidents as success.
What’s missing is a shift in mindset from tracking activity to measuring impact.
The most effective SOC metrics help answer three essential questions:
1. Are we seeing what matters?
You need clarity across your full attack surface—endpoints, cloud, identity, third parties. Gaps in log ingestion, stale detection rules, or missing assets are silent risks. The right metrics reveal your blind spots before attackers do.
2. Are we responding fast and well?
It’s not just about having playbooks. It’s about reducing Mean Time to Detect, cutting down on false positives, and ensuring your analysts aren’t burning out in triage. Metrics give you control over the process, not just the outcomes.
3. Can we prove we’re reducing risk?
Boards don’t care how many phishing emails you blocked. They care if business risk is going down. Strategic metrics translate security performance into language that executives understand. This includes risk reduction over time, containment efficiency, and automation maturity.
If a metric doesn’t answer one of these three questions, it doesn’t belong on your dashboard.
Recommended Read: If your SOC is still stuck in legacy workflows or tool sprawl, metrics alone won’t fix it. That’s where broader transformation comes in. Download the eBook: Five Essential Steps to SOC Transformation to learn how high-performing security teams use automation and AI to make metrics matter and measurable.

The Gold Standard: 15 SOC Metrics That Actually Matter
Choosing the right SOC metrics isn’t about quantity. It’s about clarity.
You don’t need a 47-line dashboard. You need a focused set of indicators that align your team’s performance with what the business actually values: visibility, speed, and risk reduction.
In this section, we’ll break down the 15 most strategic SOC metrics every CISO should track. These metrics aren’t theoretical. They’re used by high-performing security teams to make faster decisions, reduce uncertainty, and drive outcomes that matter beyond the SOC.
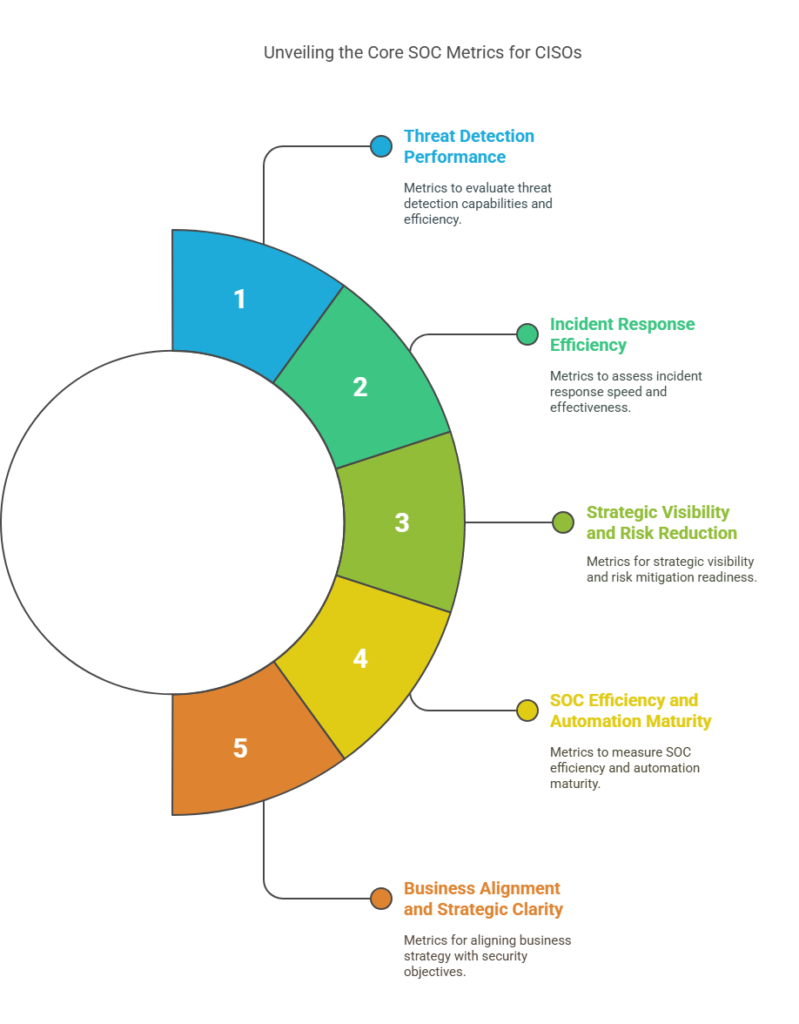
Each of these 15 metrics has been selected not just for what they measure but for what they enable. This means sharper decision-making, clearer reporting, and stronger security. Let’s start with Threat Detection Performance metrics—the front line of any SOC.
Threat Detection Performance Metrics
Detection is where everything begins. If your SOC isn’t seeing the right signals or is seeing too many irrelevant ones, then speed, response, and even automation can’t save you.
The metrics in this group focus on how quickly and accurately threats are identified, how long adversaries stay unnoticed, and how much trust you can place in the alerts you act on. These are the numbers that separate reactive teams from proactive defenders.
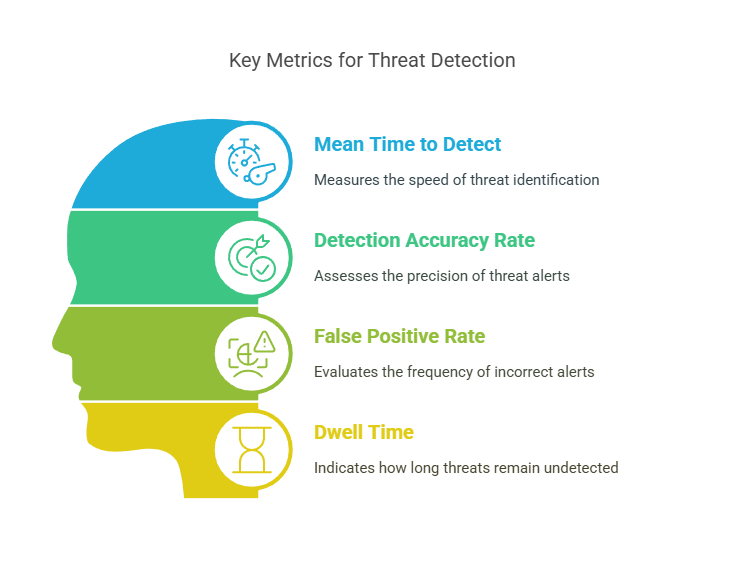
Here are the four most critical detection metrics to track:
Metric #1: Mean Time to Detect
Mean Time to Detect (MTTD) measures the average time between when a threat first enters your environment and when your team becomes aware of it.
It’s one of the most critical indicators of detection capability because it speaks to how early you can intervene. A low MTTD means you’re stopping attacks before they cause damage. A high MTTD means attackers could be moving laterally, escalating privileges, and planting persistence before you even blink.
Across mature security teams, MTTD often varies by attack vector. Email threats are typically caught faster than identity-based attacks or stealthy lateral movements. That’s why it’s important to track MTTD by threat category, not just as a single number.
Industry-leading SOCs aim for MTTD in minutes or low-single-digit hours, especially for critical assets. If you’re consistently above 24 hours for high-priority alerts, that’s a warning sign.
Pro Insight: Don’t just measure MTTD on resolved incidents. Start tracking it on near misses – those suspicious events you caught in time. That’s where maturity really shows.
Datacipher’s Tip: From our experience optimizing SOCs, MTTD improves dramatically when log gaps are closed, detection rules are continuously tuned, and telemetry from endpoints and cloud systems is correlated early. It’s not just about tooling but about orchestration.
Metric #2: Detection Accuracy Rate
Detection Accuracy Rate refers to the percentage of alerts that correctly identify real security threats, also known as true positives.
This metric is the antidote to alert fatigue. It tells you whether your detection logic is working or wasting time. When accuracy is high, analysts know they’re chasing real threats. When it’s low, everything becomes noise, and worse, it breeds complacency.
CISOs often look at the number of alerts generated per day. But that’s the wrong question. The right one is: “How many of these alerts were actually useful?”
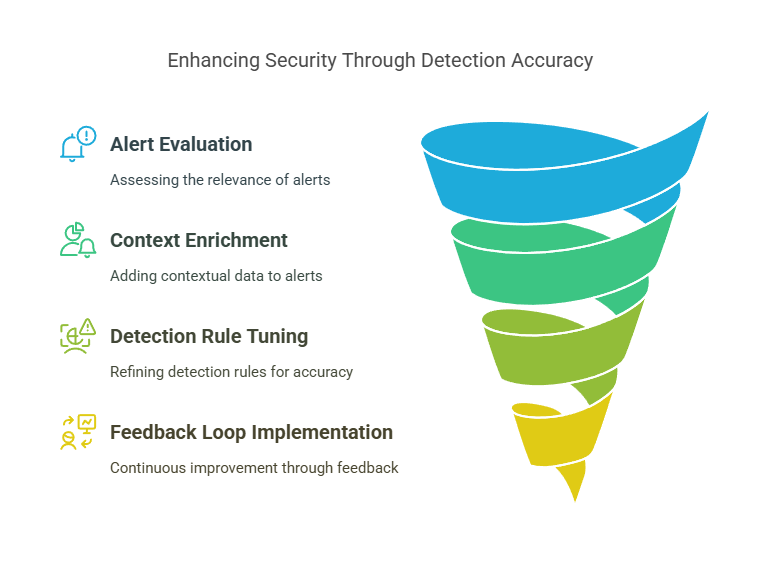
Detection accuracy is influenced by the quality of detection rules, the tuning of your SIEM or XDR, and the context enrichment applied to alerts. An alert on a failed login is noisy. An alert on a failed login from an anomalous IP with lateral movement is actionable. That’s the difference that accuracy makes.
Best-in-class security teams maintain an accuracy rate of 85% or higher. If you’re hovering below 70%, you’re burning through analyst time, delaying response, and increasing the risk of missing something critical.
Pro Insight: This isn’t a set-it-and-forget-it metric. Build a feedback loop where analysts label alert outcomes and use that feedback to auto-tune detection over time.
Datacipher’s Tip: We’ve seen SOCs improve accuracy dramatically by correlating alerts across multiple sources—endpoint, identity, cloud—rather than relying on isolated triggers. The result is fewer false alarms, faster response, and more focus where it counts.
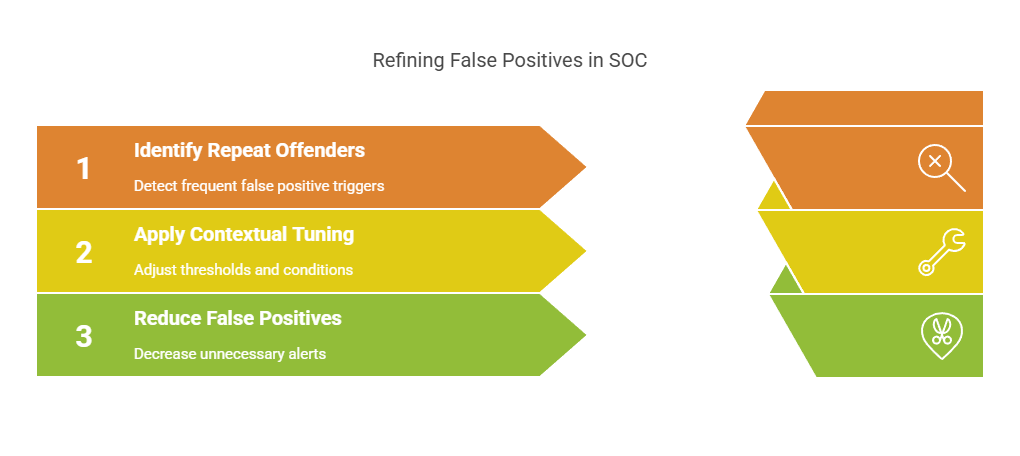
Metric #3: False Positive Rate
False Positive Rate is the percentage of alerts that turn out to be benign, irrelevant, or triggered by normal behavior.
On paper, it looks like the flip side of detection accuracy. But in practice, it carries a heavier emotional cost. High false positive rates are what burn out analysts, overload response queues, and create that dangerous mindset of “It’s probably nothing.”
This is one of the most frustrating issues inside any SOC. Your tools may be working, but if they’re crying wolf too often, no one’s listening. And when no one’s listening, that’s when real threats slip through.
It’s also one of the hardest metrics to improve. Because it requires ongoing refinement of detection rules, baselining logic, threat intel integration, and asset context. It’s not about silencing alerts. It’s about teaching your system what not to say.
A healthy false positive rate hovers around 5–10% in mature environments. If yours is consistently above 20%, it’s time to recalibrate.
Pro Insight: Start by identifying repeat offenders. The rules that trigger the most false positives. Then work backward to add context or suppress conditions that make them noisy.
Datacipher’s Tip: In high-performing SOCs we’ve worked with, false positives dropped by over 40% just by integrating behavioral baselining and adjusting thresholds based on time-of-day and user roles. Contextual tuning is where precision lives.
Metric #4: Dwell Time
Dwell Time is the total amount of time an attacker remains undetected in your environment, from initial compromise to first detection.
It’s the chilling metric that often doesn’t show up until after an incident has already happened. And by then, it’s usually a postmortem. Long dwell times are how attackers move laterally, escalate privileges, exfiltrate data, and plant persistence without raising alarms.
This metric reflects the true effectiveness of your detection strategy, not just whether it triggers alerts but whether it triggers them in time. It exposes visibility gaps: misconfigured logging, blind cloud zones, and neglected service accounts. Dwell time is often where a breach goes from containable to catastrophic.
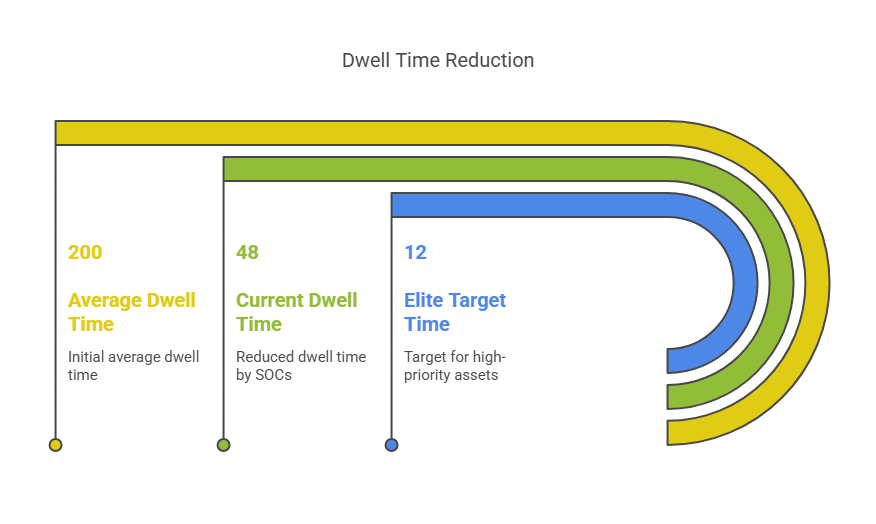
Historically, the average dwell time was over 200 days. Today, leading SOCs bring it down to under 48 hours. Elite organizations aim for under 12 hours for high-priority assets and external attack paths.
Pro Insight: Don’t treat Dwell Time as a global number. Track it by threat vector, including malware, credential abuse, and insider activity. You’ll quickly see where your visibility is weakest.
Datacipher’s Tip: The most effective reductions in dwell time come from automated lateral movement detection and identity behavior monitoring. Attackers don’t stay quiet; they stay subtle. Your SOC’s job is to recognize the pattern, not just the noise.
Incident Response Efficiency Metrics
Detection is only half the story. Once a threat is discovered, the clock starts ticking, and your response process becomes a race against damage.
This group of metrics measures how fast, how well, and how consistently your SOC responds to the threats it detects. It’s where the technical team’s discipline, automation, and playbook design come into sharp focus.
Why does this group matter so much? Because a delayed response often means:
- More systems impacted
- Higher remediation costs
- Greater legal, regulatory, and reputational risk.
And let’s not forget: the board doesn’t just ask if you detected something. They ask, “What did you do about it and how fast?”
These metrics help you answer that question with confidence, not excuses.
Let’s start with the most fundamental one: Mean Time to Respond.
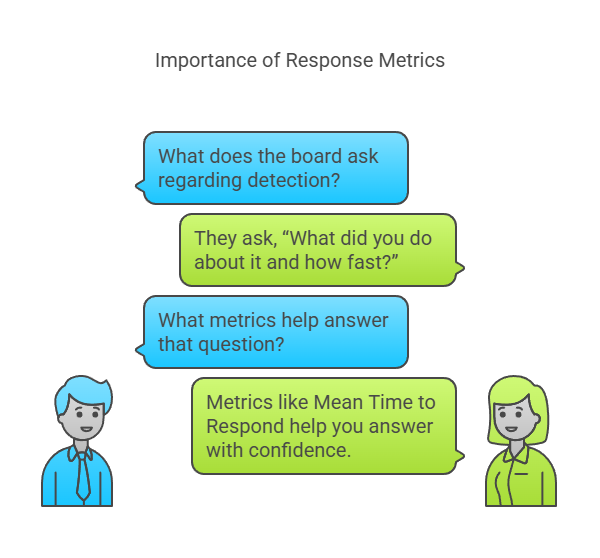
Metric #5: Mean Time to Respond
Mean Time to Respond (MTTR) measures the average time your SOC takes to respond to a threat after it has been detected, This might mean containment, mitigation, or full resolution.
It’s the second half of the MTTD/MTTR pair and just as critical. You can detect a threat in five minutes, but if you take five hours to respond, the damage is already done. MTTR tells you how agile your playbooks are, how empowered your analysts feel, and how integrated your response tooling is.
It also reflects operational friction. If the response team is waiting on approvals, lacking clarity on ownership, or working with siloed systems, MTTR climbs. On the other hand, when response actions are automated or clearly orchestrated across tools, MTTR drops and outcomes improve dramatically.
The best SOCs aim for MTTRs of under 30 minutes for critical alerts and under 4 hours across the board. Anything higher invites more risk than most execs are comfortable with.
Pro Insight: MTTR is a system metric, not a person metric. Don’t blame analysts, but rather look at bottlenecks in tooling, process, and decision-making.”
Datacipher’s Tip: We’ve helped teams slash MTTR by building automated containment actions into their SOAR platforms. This means quarantining devices, disabling accounts, or blocking IPs within seconds of detection. MTTR isn’t just about moving fast, it’s about designing your SOC in a way that fast is possible.
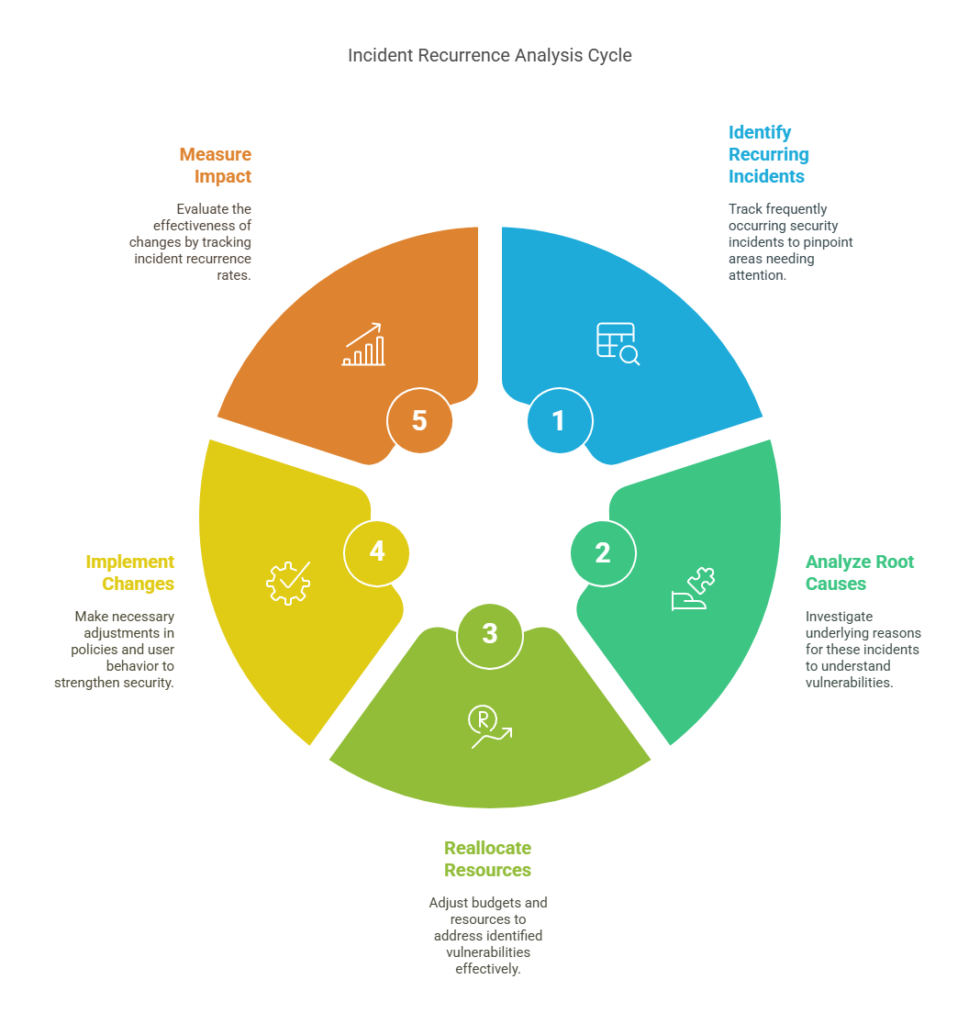
Metric #6: Top 5 Repeated Incidents
This metric tracks the most frequently recurring security incidents over a defined time period. These are tracked typically by category, for e.g., phishing, endpoint malware, misconfigurations, credential abuse.
It matters because recurrence reveals root cause issues. If the same type of incident keeps showing up, it means your controls are misaligned, your users are vulnerable, or your threat actors have found a reliable gap to exploit.
This metric isn’t just for detection tuning. It’s a posture barometer. It helps CISOs reallocate budgets, fix process leaks, and push for upstream changes in user behavior, IAM policy, or endpoint hardening.
It’s especially valuable for storytelling. When a CISO walks into a board meeting and says, “We’ve reduced phishing recurrence by 72% in Q2,” that’s a signal of progress. Not just activity.
Pro Insight: Segment this data by business unit or user group. Repeated incidents in one department often signal a local process or training issue, not a systemic flaw.
Datacipher’s Tip: In our security assessments, this is one of the most neglected but high-leverage metrics. When tracked consistently, it becomes a roadmap for long-term control improvement and often flags issues long before audit findings do.
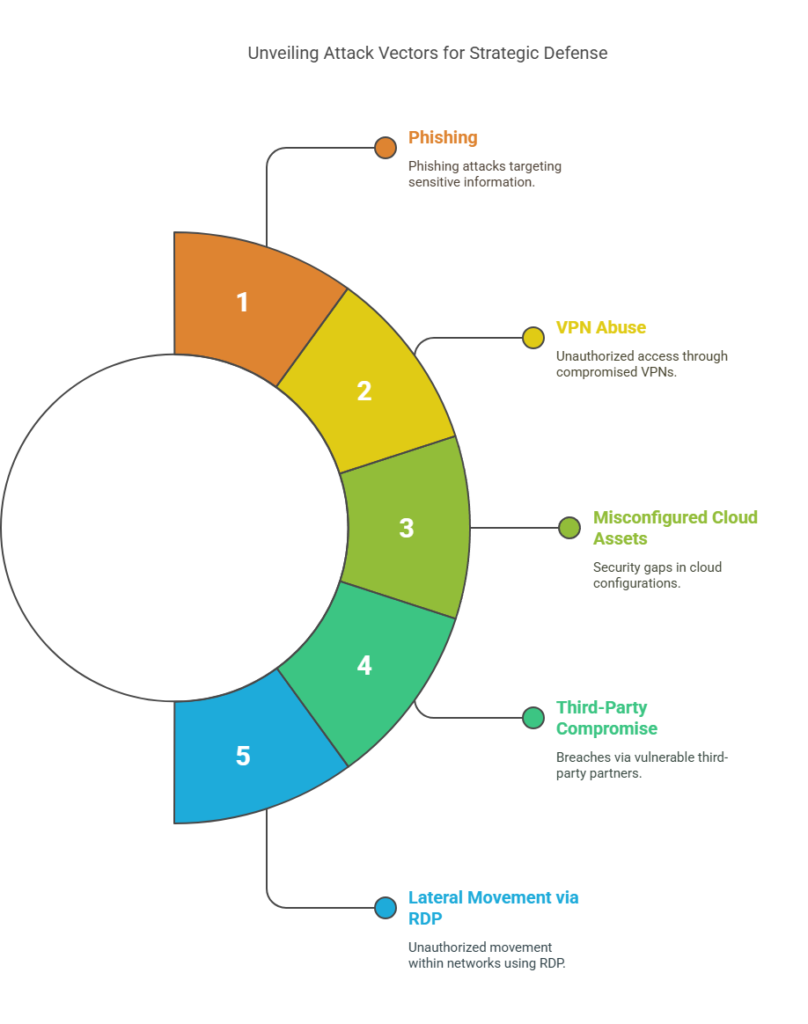
Metric #7: Incident Volume by Attack Vector
The Incident Volume by Attack Vector breaks down the total number of security incidents by the method of attack. Whether it’s by phishing, VPN abuse, misconfigured cloud assets, third-party compromise, or lateral movement via RDP.
This metric gives you threat intelligence at a tactical level. It doesn’t just show what’s happening. But shows how it’s happening and which doors attackers prefer to use.
This metric helps CISOs focus resources where it really counts. If 45% of incidents stem from credential abuse and only 3% from malware, why would you invest equally in both? Knowing your most exploited vectors informs training, tooling, and architectural priorities.
It also plays well in cross-functional meetings. When security leaders can show that 60% of threats are coming from phishing attempts tied to HR systems, it creates buy-in for access policy changes, MFA mandates, or better phishing simulations.
Pro Insight: Use this data to prioritize threat hunting. If VPN-based access abuse is trending, shift your analyst focus there, even if alerts seem low-volume.
Datacipher’s Tip: We often see this metric overlooked when logs aren’t normalized or when SOCs rely too heavily on alert categories. Invest in incident tagging and consistent classification so this view becomes reliable and real-time.
Strategic Visibility and Risk Reduction Metrics
This is where tactical metrics evolve into strategic signals. These metrics are less about real-time operations and more about answering big-picture questions:
- Are we covered where it matters most?
- Is our attack surface shrinking?
- Are we actually improving over timeor just getting better at firefighting?
These are the metrics that help CISOs communicate beyond the SOC. They shape executive narratives, guide budget conversations, and support audit-readiness. Most importantly, they connect security performance to business risk.
They’re not always as easy to measure. But when tracked consistently, they become a powerful asset in every CISO’s playbook.
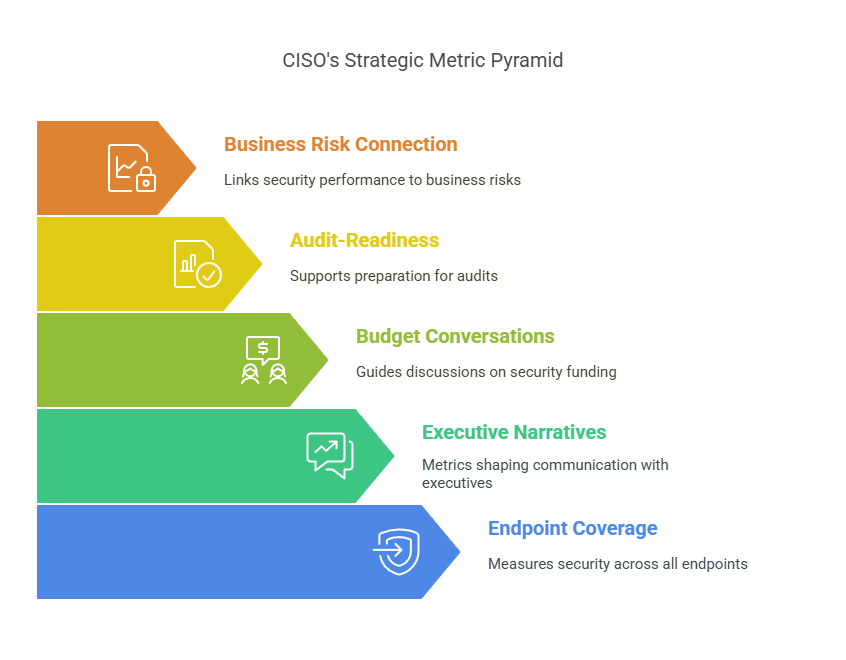
Let’s begin with the most fundamental: Endpoint Coverage Ratio.
Metric #8: Endpoint Coverage Ratio
Endpoint Coverage Ratio measures the percentage of all endpoints—laptops, servers, VMs, mobile devices, containers – that are actively monitored by your EDR, XDR, or endpoint management solutions.
It sounds simple, but it’s often one of the most misleading metrics in the SOC. Many teams track only active devices. But the real question is: What percentage of total known endpoints are being tracked in real time and how many are flying under the radar?
Endpoints remain one of the most common breach vectors. If even 5–10% of your assets are unmonitored, those become ideal targets for lateral movement, malware staging, and long-term persistence.
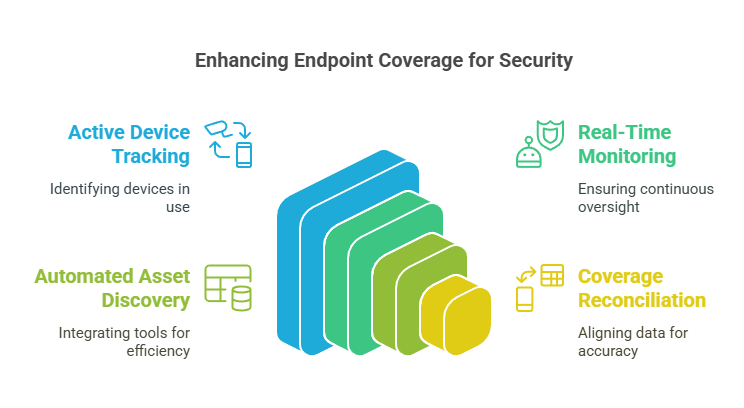
A high endpoint coverage ratio – ideally above 95% – marks a well-integrated SOC. Anything below 85% should raise flags, especially in distributed or hybrid environments.
Pro Insight: This metric should include cloud workloads and BYOD endpoints where applicable. A 98% coverage rate on paper means nothing if your fastest-growing asset class isn’t even counted.
Datacipher’s Tip: The biggest gains come from automated asset discovery paired with continuous coverage reconciliation. We’ve seen coverage jump 20% simply by integrating endpoint tools with identity directories and cloud inventories.
Metric #9: Cloud Asset Visibility
Cloud Asset Visibility measures how many of your cloud resources – VMs, storage buckets, identities, APIs, containers, serverless functions – are being actively monitored and logged by your SOC tools.
This isn’t just about counting assets. It’s about understanding how many of those assets are:
- Accounted for in your CMDB.
- Streaming logs to your SIEM or XDR.
- Covered by detection rules or security policies.
Cloud environments change daily. Developers spin up services on demand, and shadow IT grows organically. Without automated discovery and tight integration with cloud platforms (AWS, Azure, GCP), your SOC loses sight of where risk is actually accumulating.
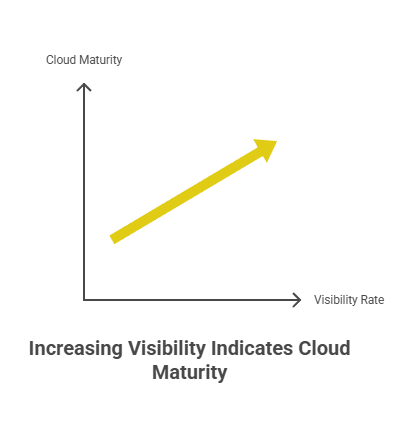
A visibility rate above 90% is a strong sign of cloud maturity. Below 75%, you’re likely missing threat activity in critical workloads, especially those tied to CI/CD pipelines, SaaS integrations, or customer-facing systems.
Pro Insight: Don’t just track visibility by raw count. Break it down by sensitivity or criticality of the asset. Missing logs from dev VMs is one thing. Missing logs from production IAM configs is a breach waiting to happen.
Datacipher’s Tip: Some of the best gains come from integrating cloud security posture management tools with your SIEM/XDR pipeline. It’s not enough to see that an S3 bucket exists. You need to know if it’s public, unencrypted, and unmonitored. Visibility isn’t just seeing the cloud. It’s understanding the risk within it.
Metric #10: Log Ingestion Coverage
Log Ingestion Coverage measures the percentage of critical systems and data sources actively sending logs to your SIEM, XDR, or centralized logging platform. This includes endpoints, servers, network gear, cloud services, identity providers, and third-party apps.
If core infrastructure isn’t logging—or if logs aren’t normalized, enriched, or even ingested, you’re flying blind. This is one of the most dangerous visibility gaps in enterprise security.

High log ingestion doesn’t just mean more data. It means better context, better correlation, and higher detection fidelity. The goal isn’t to log everything. It’s to log everything that matters, with the right level of detail, in near real-time.
A healthy environment aims for 95–100% coverage of Tier 1 assets and identity systems. Anything less, and your SIEM might miss early indicators of compromise, lateral movement, or privilege abuse.
Pro Insight: Log ingestion should be measured not just in volume, but in criticality-weighted completeness. A missing domain controller log is far more damaging than a missing printer event.
Datacipher’s Tip: We often recommend creating a log ingestion heatmap tied to asset criticality. That way, teams don’t just chase percentages; they close gaps where risk actually resides. Most breakthroughs come from fixing blind spots in identity systems, legacy infra, and multi-cloud APIs.
SOC Efficiency and Automation Maturity Metrics
You can have the best tools in the world. But if your team is stuck doing repetitive tasks, your SOC won’t scale. The following metrics focus on how efficiently your resources—both human and machine—are being used. These metrics shine a light on analyst workload, process friction, and the level of automation maturity inside your environment.
As threats grow faster and more complex, efficiency becomes a competitive edge. It’s not just about cutting costs. It’s about freeing up time for deeper investigations, proactive threat hunting, and strategic planning.
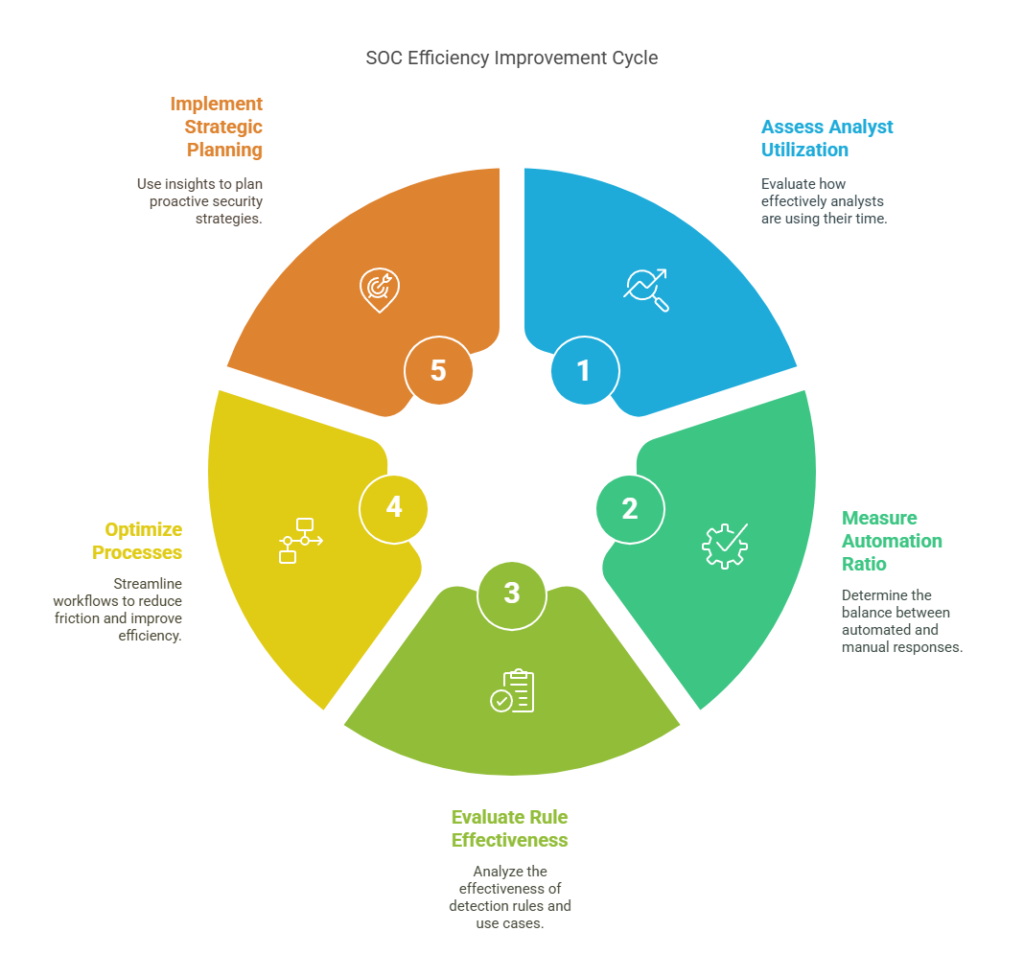
These metrics help you answer:
- Are my analysts spending time where it matters?
- Are my response processes scalable?
- Are my detection rules delivering real value?
This is where operational excellence begins.
Metric #11: Analyst Utilization Rate
Analyst Utilization Rate tracks how much time your security analysts spend on meaningful, value-generating tasks—such as investigation, containment, and threat hunting—versus time spent on repetitive triage, false alarms, or administrative overhead.
It’s one of the most human metrics in your SOC – and one of the most telling. If your analysts are overwhelmed by junk alerts, ticket queues, or broken processes, burnout follows. And when burnout sets in, so do missed detections and high turnover.
This metric helps CISOs identify where people are doing what automation should and whether their talent is being used for impact or maintenance. It also helps justify headcount, reallocate tasks, or accelerate SOAR adoption.
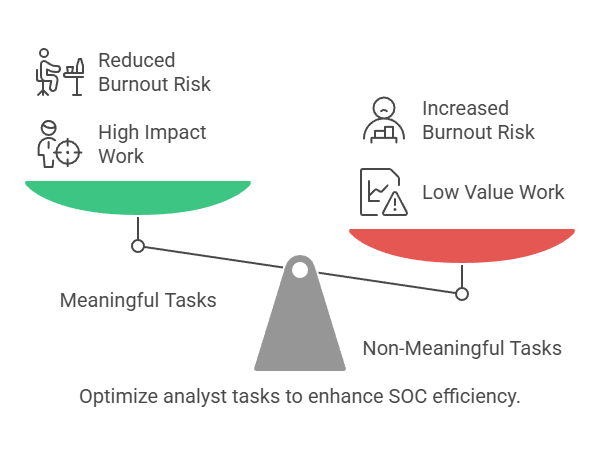
Mature teams aim to keep analyst utilization for Tier 1+ work above 60–70%. Anything lower suggests your team is stuck in alert-fatigue mode, not threat-response mode.
Pro Insight: Break this down by role and shift. Tier 1 is expected to work on 90% triage. But if Tier 2 and Tier 3 analysts spend more time reviewing logs than closing incidents, something’s off.
Datacipher’s Tip: We’ve helped SOC teams recover over 30% of analyst time just by automating ticket enrichment, correlation, and alert deduplication. The goal isn’t to squeeze more from your people. It’s to remove the noise that wastes their talent.
Metric #12: Automated vs Manual Response Ratio
Automated vs Manual Response Ratio tracks the percentage of security incidents that are handled fully or partially by automated workflows versus those requiring manual intervention from analysts.
This is the metric that shows whether your SOC is scaling or stalling.
Without automation, response times slow, fatigue sets in, and false negatives rise. Automation doesn’t replace analysts. It amplifies them by removing the repetitive steps so they can focus on what machines can’t do.
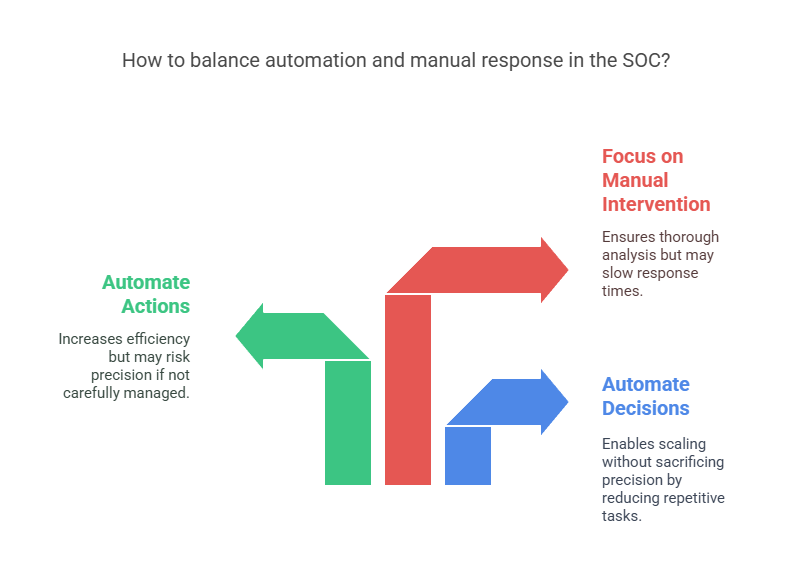
There’s no one-size-fits-all number here, but mature SOCs often aim for 40–60% of responses to involve some level of automation.
Pro Insight: Start by automating decisions, not just actions. If your SOAR can make triage calls based on logic and context, you’ll unlock scale without sacrificing precision.
Datacipher’s Tip: We recommend starting with containment automation for low-risk, high-frequency incidents like isolating infected endpoints or disabling compromised accounts. It’s where most SOCs win their first major efficiency gains without fear of overreach.
Metric #13: Use Case / Rule Effectiveness
Use Case or Rule Effectiveness measures the percentage of active detection rules, playbooks, or use cases in your SIEM or XDR that are actually producing meaningful detections; i.e., true positives that lead to action.
Most SOCs suffer from “rule bloat.” They accumulate hundreds of correlation rules, detection use cases, and threat models over time, but only a fraction are relevant or useful. The result is wasted compute, noisy dashboards, and a false sense of coverage.
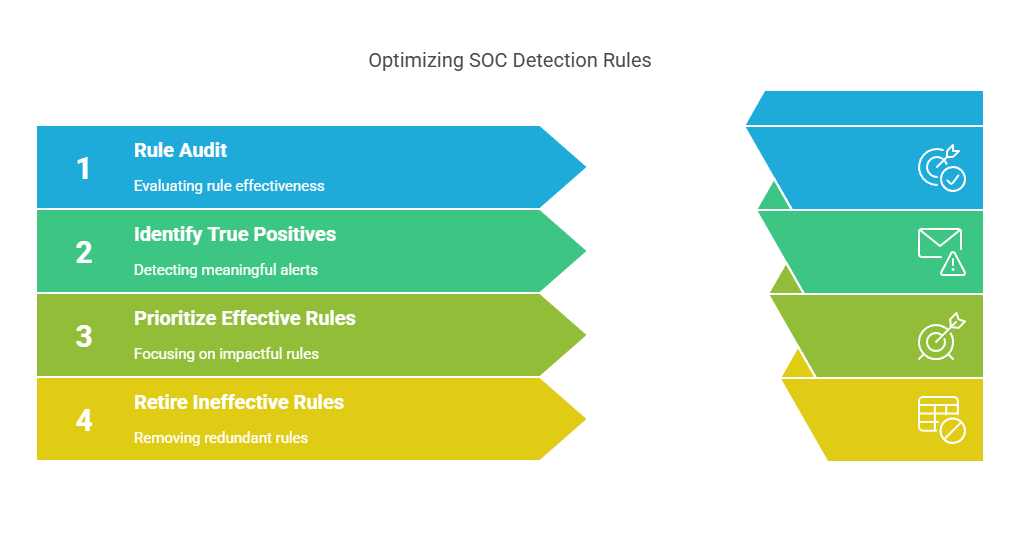
This metric helps you prioritize which rules are pulling their weight and which need to be retired, tuned, or rewritten. It also supports a lean, responsive SOC that can adapt quickly to evolving threats.
A strong baseline is having at least 30–40% of use cases generating real alerts quarterly. Anything less often means your detection strategy is over-engineered and underperforming.
Pro Insight: Track not just how many rules fire, but how many led to escalation, containment, or validated threats. That’s how you separate signal from static.
Datacipher’s Tip: In rule audits we’ve led, the biggest gains came from aligning use cases with MITRE ATT&CK coverage and threat intel feeds. The goal isn’t more rules. It’s more effective ones tied to actual risk.
Business Alignment and Strategic Clarity Metrics
This is where metrics leave the console and enter the boardroom.
These metrics measure outcomes, not just outputs. While the earlier groups focused on detection, response, and visibility, these final two metrics capture what really matters to the business:
- Are we controlling access intelligently?
- Are we reducing enterprise risk over time?
These are the signals that CISOs rely on when they’re not just reporting up, but leading across. They turn security from a technical function into a strategic advantage.
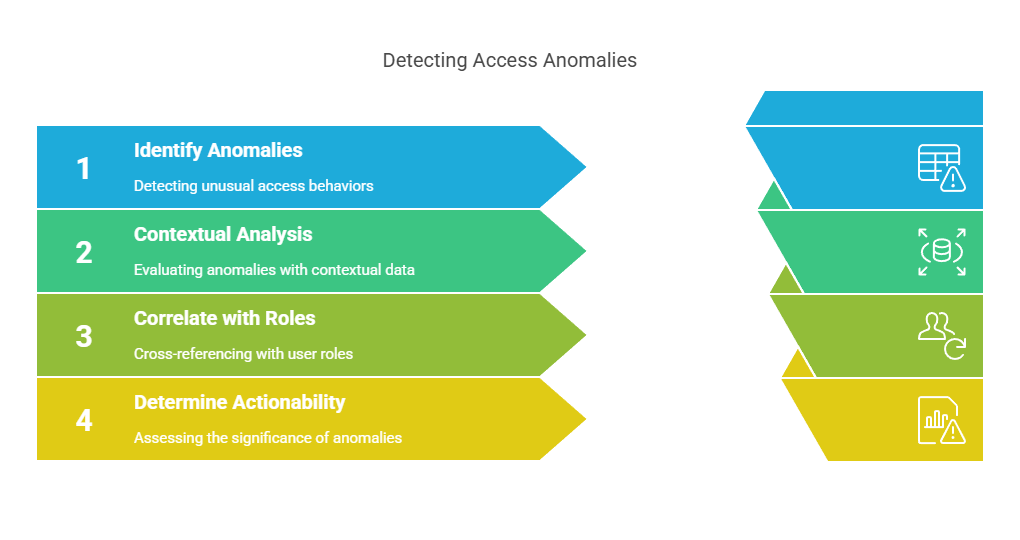
Metric #14: Access Anomalies and Privilege Misuse
Access Anomalies and Privilege Misuse refers to the detection of suspicious behavior tied to identities, accounts, or entitlements. This includes unusual login times, privilege escalation, access to high-risk systems without prior context, or abuse of admin rights.
In the modern threat landscape, identity is the new perimeter. Attackers don’t break in; they log in. And when insider threats or compromised accounts go unnoticed, the damage can be deeper and stealthier than any malware.
This metric helps track how well your SOC detects behavioral deviations. These are the subtle shifts that often precede lateral movement, data exfiltration, or sabotage. It’s where UEBA (User and Entity Behavior Analytics), IAM integration, and zero trust monitoring come into play.
There’s no universal benchmark here. But the trend to track is detection frequency and contextual accuracy. Are you catching these anomalies consistently? And are they meaningful, not just noise?
Pro Insight: Cross-reference anomalies with HR and business context. A new admin accessing critical finance data may be fine, unless they were just put on a performance improvement plan.
Datacipher’s Tip: In our investigations, the SOCs that surface the most actionable identity threats are those that integrate login telemetry with behavioral baselines and actively correlate access activity with user role changes or anomalous system use. It’s where security meets sociology.
Metric #15: Risk Reduction Over Time
Risk Reduction Over Time is a composite metric that tracks whether your overall security posture is improving quarter over quarter. These metrics are calculated based on reduced exposure, faster response, fewer incidents, stronger controls, or lower dwell times.
Unlike raw incident counts or alert volumes, this metric captures strategic momentum. It shows whether your SOC is just working harder or actually making the organization safer. It’s the difference between measuring motion and proving progress.
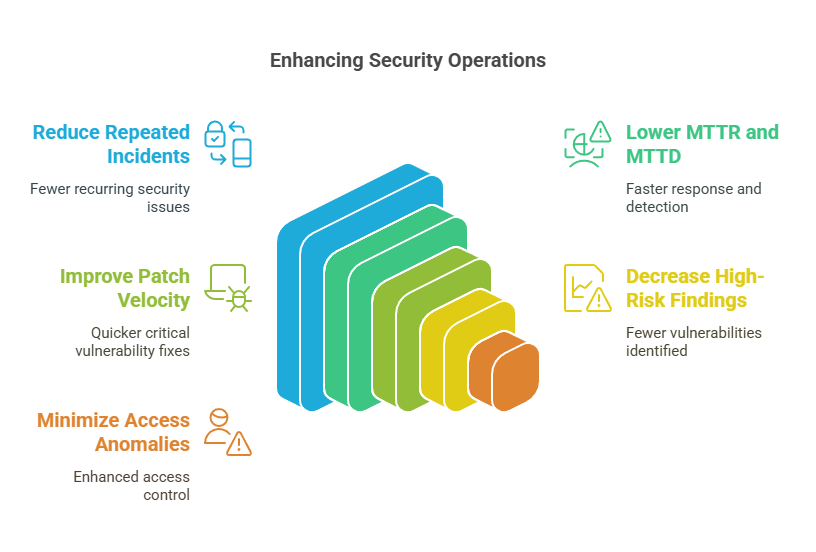
There’s no one formula here. Some teams build it from:
- Fewer repeated incidents
- Lower MTTR and MTTD
- Better patch velocity on critical CVEs.
- Decreased high-risk findings in vulnerability scans.
- Reductions in access anomalies or shadow assets.
What matters is not perfection, but the trend. When the board asks, “Are we getting better?” — this is the metric you show.
Pro Insight: Build this into your quarterly SOC reporting deck. Even if it’s directional, it helps shift perception from security as a cost center to security as a risk-reducing function.
Datacipher’s Tip: We recommend framing this visually, not just numerically. A simple trendline or heatmap showing posture improvement across business units or asset groups can make complex metrics understandable and powerful in budget conversations.
What to Do With These SOC Metrics So You Don’t Just Admire Them?
These 15 SOC metrics don’t just belong in a dashboard. They belong in your decision-making.
Yet, in most organizations, even the best metrics become passive data. They’re reviewed once a month, maybe, during a status update, or worse, they live in dashboards no one opens unless there’s a breach.
For metrics to deliver impact, they need to be:
- Mapped to real-world actions.
- Tied to specific owners.
- Reviewed as part of operational cadence.
- Used to drive resource and architectural decisions.
Let’s break that down.
1. Design Metrics Around Decisions, Not Reports
Every metric should answer a question that matters to someone.
For example:
- If your MTTD is rising, what do you cut: false positives, alert volume, or improve signal correlation?
- If your dwell time is flat, do you review detection rules, or are threat behaviors not mapped well to ATT&CK?
- If your incident volume by vector shows a spike in VPN abuse, is that a detection gap or an IAM policy issue?
If a metric doesn’t lead to a conversation or action, it’s just noise. Before you present metrics, ask yourself: What decision does this metric enable?
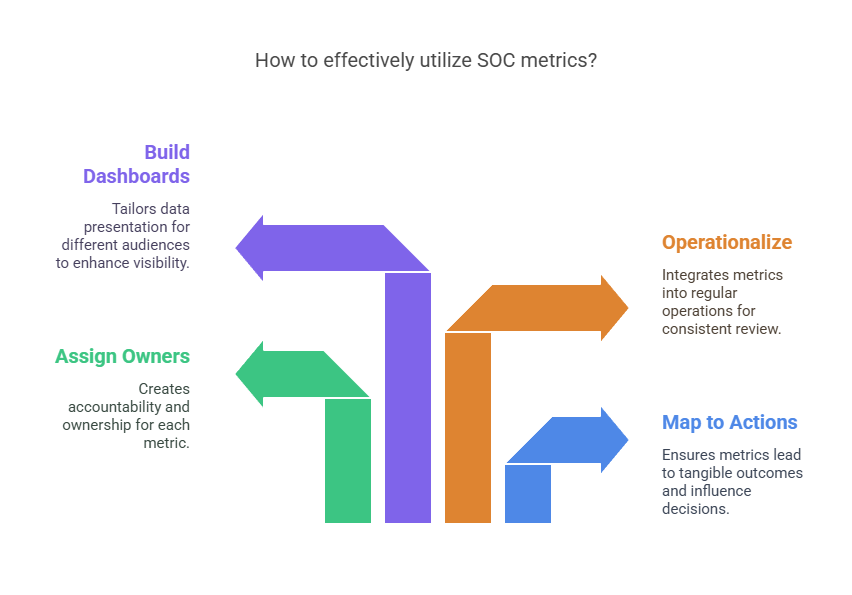
2. Assign Ownership: One Metric, One Accountable Team
Metrics need owners. Not passive viewers but accountable operators. For instance, each of these metrics can be assigned to the following roles:
- Response metrics (MTTR, automation ratio) — Incident response teams or SOAR architects.
- Coverage metrics (endpoint/cloud/logs) — Infrastructure, cloud security, or SOC architecture.
- Business alignment metrics — CISO, risk officers, GRC leads.
When ownership is unclear, action stalls. Build metric accountability into job roles, not just reports.
3. Operationalize Metrics into Daily and Weekly Cadence
Metrics don’t belong in static monthly decks. They belong in SOC rituals. Here are a few steps CISOs should take:
- Review high-noise rules and top false positives during daily triage standups.
- Measure analyst utilization weekly to flag burnout early.
- Monitor use case effectiveness monthly to prune low-value rules.
- Report risk reduction and dwell time quarterly to show strategic progress.
The goal is not to be more reactive but to be more deliberate. Metrics should be the heartbeat of how your SOC evolves.
4. Build Layered Dashboards for Different Audiences
No single dashboard serves everyone. CISOs should build tiered visibility. For instance,
- Executives need trendlines, deltas, and risk visuals (e.g., MTTD trends, dwell time, coverage gaps).
- SOC managers need operational breakdowns (e.g., rule effectiveness, analyst workload).
- Engineers need raw data to tune systems (e.g., log ingestion volumes, use case firing rates).
When dashboards are tailored, metrics get used. When they’re one-size-fits-all, they get ignored.
5. Focus on Trendlines, Not Snapshots
Metrics only matter when they show momentum.
A 30-minute MTTR doesn’t mean much without context. Has it improved from 2 hours? Has it stagnated for three quarters? Is it better in some business units and worse in others?
Highlight quarter-over-quarter deltas. Annotate major shifts like the drop in dwell time after deploying a new EDR or SOAR playbook. These stories help leadership see that security isn’t just reactive; it’s evolving.
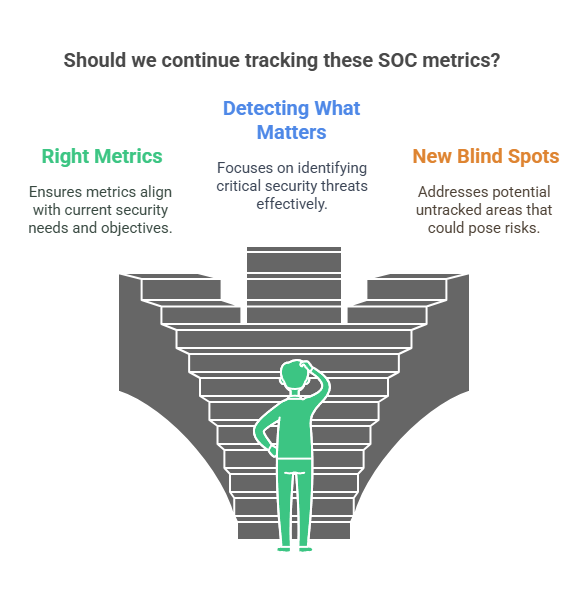
6. Audit Metrics Quarterly for Relevance
Your threat landscape shifts. So should your metrics.
Review these metrics every 3–6 months. Ask yourselves these questions:
- Are these still the right metrics for where we are?
- Are they helping us detect what actually matters today?
- Are there new blind spots we aren’t tracking?
Mature SOCs treat metrics as living systems, not fixed scorecards.
The bottom line is that Metrics don’t just describe your security posture. They shape how it changes and how quickly. The best SOC leaders use them as steering wheels, not rear-view mirrors.
6. Closing the Loop: From Metrics to Mastery with Datacipher
Metrics aren’t the goal. They’re the instrument.
The 15 SOC metrics we’ve covered in this article give CISOs more than just numbers. They provide clarity, focus, and leverage. They help you make sharper decisions, prioritize what truly matters, and prove your security team’s impact beyond the walls of the SOC.
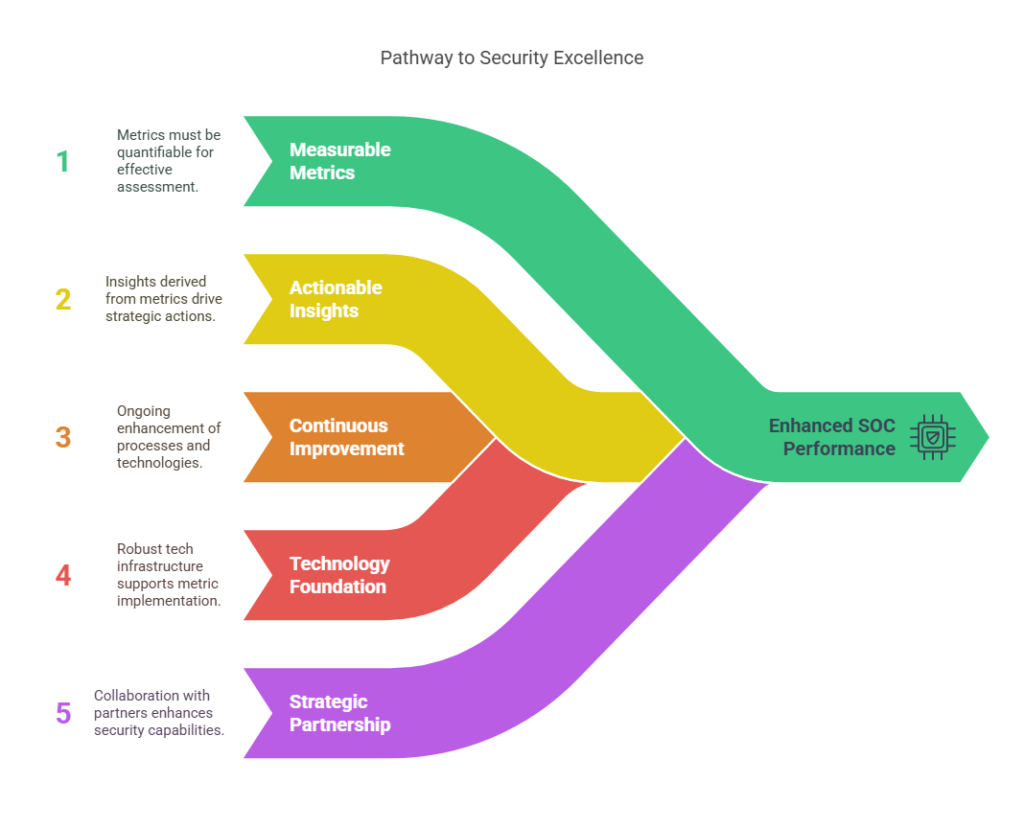
But metrics only matter if they’re measurable, actionable, and continuously improving. That’s where the right technology foundation—and the right partner—makes all the difference.
Datacipher is built to support exactly what these metrics reveal: where your SOC is strong, where it’s struggling, and what needs to improve. We don’t just hand you dashboards. We help your security function operate with the clarity these metrics demand.
- If visibility metrics like MTTD, dwell time, or log coverage are weak, we deploy engineers to tune your SIEM, close telemetry gaps, and improve detection across endpoints, cloud, and identities.
- If response metrics like MTTR or containment time are too high, we help automate workflows, design SOAR playbooks, and eliminate delays in decision-making.
- If false positives, rule fatigue, or analyst overload are slowing your team down, we audit and optimize detection rules, remove noise at the source, and improve signal quality.
- And if strategic metrics—like risk reduction over time—are hard to prove, our vCISO and compliance experts align your operations with NIST, ISO, and CIS frameworks, helping you tie SOC performance to business risk.
Case in Point: A regional financial services company approached Datacipher after struggling with analyst burnout and an MTTR that averaged over 18 hours. We implemented a tiered alerting strategy, automated the containment of low-risk threats, and fine-tuned their detection rules across EDR and identity platforms.
Within three months, their false positive rate dropped by 42%, and MTTR fell to just under four hours, while giving analysts more time for deep investigations.
At every step, we’re not just improving metrics. We’re making your SOC smarter, faster, and more defensible at both the technical and board level. Explore how we can operationalize SOC metrics for your enterprise.
Frequently Asked Questions around SOC Metrics
1. How often should SOC metrics be reviewed or updated?
At a minimum, review your core SOC metrics monthly—and revisit your entire metric set quarterly. Mature SOCs track key indicators like MTTR, MTTD, and false positive rates weekly, sometimes daily. The real value comes from spotting trends early, not reacting late. If a metric hasn’t influenced a decision in 90 days, it’s either irrelevant or being ignored.
2. What tools are best for tracking these SOC metrics effectively?
The right tools depend on your stack but most organizations rely on a combination of SIEM (like Splunk, Sentinel), SOAR, EDR, and threat intel platforms. For executive-level clarity, overlay these with a BI layer like Power BI or Tableau. The key isn’t just collection; it’s correlation and visualization that turns raw data into decision-making fuel.
3. How do I know if my SOC metrics are actually improving?
Improvement shows up in trends, not snapshots. If your MTTD is decreasing over three quarters, or your false positives are dropping without hurting detection accuracy, you’re maturing. Look for consistency, not just spikes. If your SOC is getting faster, quieter, and smarter—that’s your proof.
Bonus: your analysts will feel the difference before your dashboards show it.
4. How do I benchmark my SOC metrics against industry standards?
Start with published data from SANS, IBM, Mandiant, and Verizon DBIR reports. Compare metrics like MTTR, dwell time, and false positive rates. But remember, benchmarks are just baselines. Context matters. A financial services SOC and a mid-sized SaaS company won’t look the same. Benchmark internally, too: quarter-over-quarter improvements matter more than matching a global average.
5. What’s the most common mistake CISOs make when reporting SOC metrics?
Reporting everything. Too many metrics dilute the message. The board doesn’t need 47 charts. They need four clear signals tied to risk, performance, and resilience. Another common mistake? Focusing on raw activity (alerts processed) instead of outcomes (breaches prevented, risk reduced). Less data is equal to more meaning. That’s how security earns trust at the top table.
6. How do SOC metrics support compliance audits and certifications?
Good metrics show that controls are working. For frameworks like ISO 27001, NIST, or PCI DSS, metrics help you prove detection, response, and coverage maturity. They also highlight gaps early, so you’re not scrambling during audits. If you’re measuring log coverage, incident response times, or access anomalies, you’re already building a strong audit trail.
7. Can outsourced SOCs deliver the same level of metric-driven visibility?
Yes, if they’re built for it. A mature outsourced SOC should give you full visibility into detection quality, response times, and coverage gaps, ideally through real-time dashboards and quarterly reviews. If you’re stuck waiting for PDF reports or lack insight into how metrics are generated, it’s time to reassess.